誰でも副業で稼ぎたいと思ったことがあると思います。
ですが、実際やろうと思っても何から始めれば良いのかわからない人がいると思い記載してみました。
今回は誰でもできるように簡単なやり方を紹介したいと思います。
それは、だれでも持っているスマホ一台で稼げます。
しかもネットサーフィンするだけで稼げるので夢のようですね。
やり方
お使いのスマートフォンに「Brave」をインストールして設定して、あとはお好みでネットサーフィンするだけで稼げます。
設定方法については下記で解説しています。
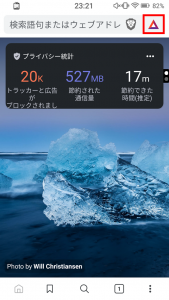
「Brave」ブラウザを起動して、新規タブを開き右上のアイコンを押下します。
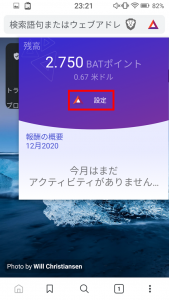
設定を押下する。
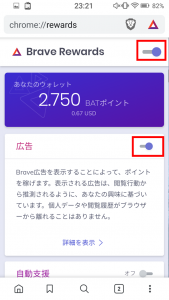
上記の設定をonにして広告で利益が入るようになります。
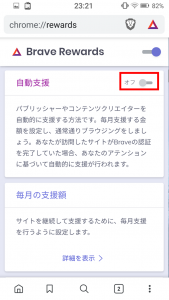
貯めたものを減らさないように自動支援をoffに設定します。
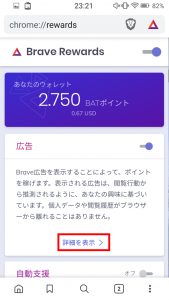
報酬を増やすために上記の画面の詳細設定を押下します。
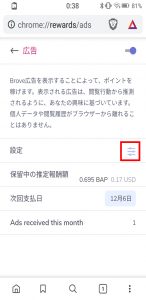
上記のアイコンを押下します。
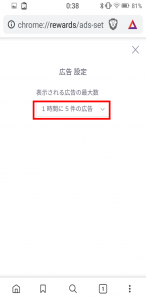
「1時間に5件の広告」に設定することで報酬が増えます。
「Brave」ブラウザのメリット
ウェブサイトの広告がカットされるのでとても便利です。
不要な通信がなくなるため表示速度が改善されたり、通信の節約になります。
YouTubeをよく見る人はBraveを絶対活用したほうがいいです。
動画の途中でCMがカットされるのでストレスなく視聴できます。
また、音楽をバックグランド再生できるので私は愛用しています。
もちろん無料で使用できます。
パソコン版もありますので両方で稼げます。